← Back to the timeline
2009: Sixth-lowest inflow since 1921
A serious drought driven by a low snowpack: inflow to Okanagan Lake was the sixth-lowest since records began in 1921, worse than 2003. Irrigation districts imposed Stage 2 restrictions and cut farm allotments; this is the year the OBWB began basin-wide drought planning.
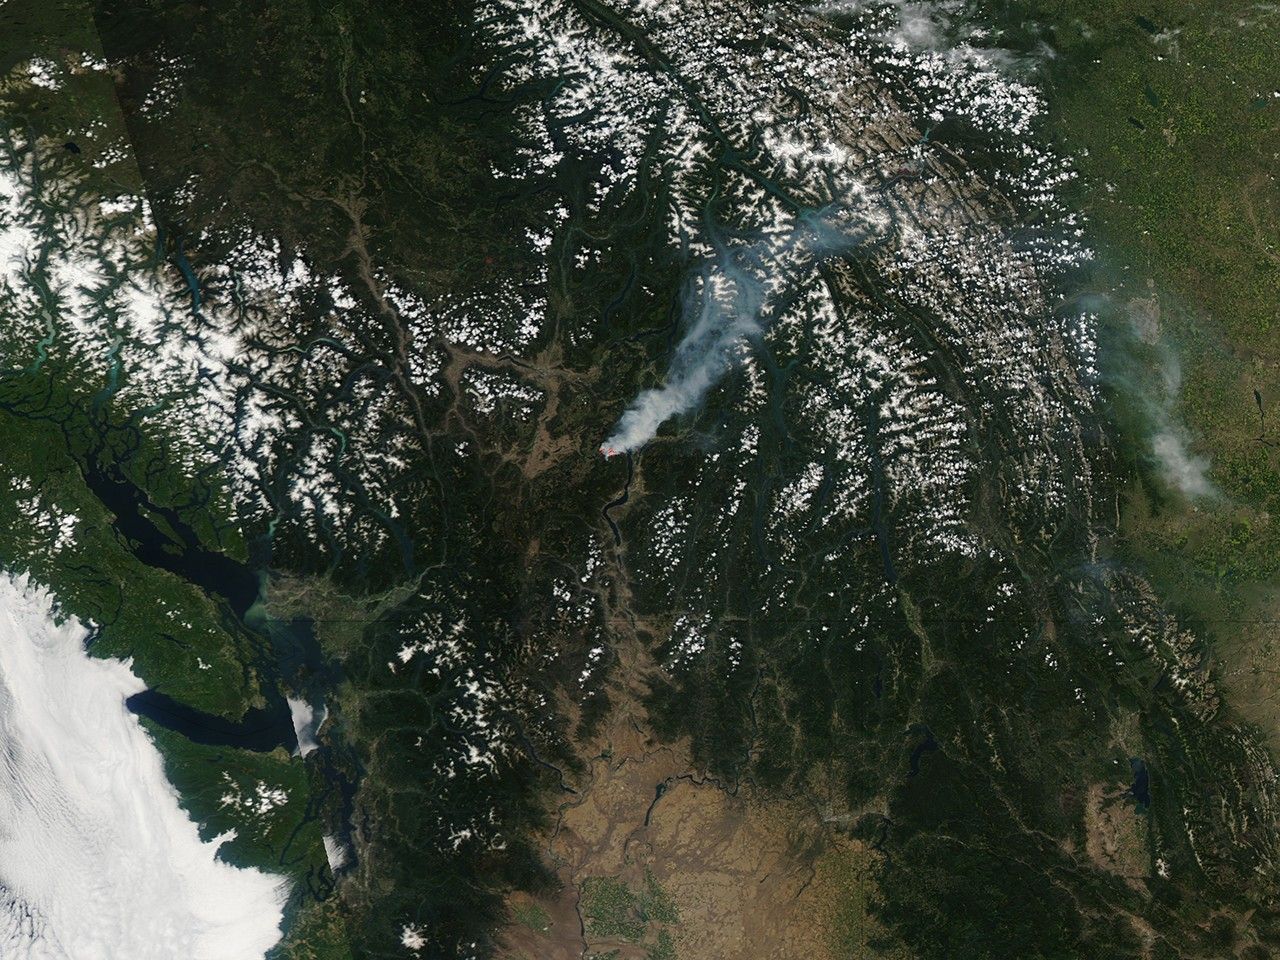
2009 is the drought that reshaped local water governance: the year staged watering restrictions and basin drought planning became standard practice.
Local government & infrastructure
- The South East Kelowna Irrigation District (SEKID) implemented Stage 2 watering restrictions: lawn watering limited to two days per week, no watering between 10:00 a.m. and 6:00 p.m., and bans on washing sidewalks/driveways/parking lots, dust-control watering, washing buildings, and flushing roof gutters. [High] (source)
- SEKID cut farmers’ annual water allotment by 20 percent, with the board of trustees retaining the option to discontinue (shut off) service for non-compliance. SEKID supplies up to 85 percent of its water to farmers. [High] (source)
- SEKID’s McCulloch Lake reservoir (East Kelowna water source) sat at roughly two-thirds of its average level; storage was projected to potentially fall from about 9,000 acre-feet to 1,800 acre-feet. A 17-year camp host called it the lowest he had ever seen it in June. [High] (source)
- Westbank and South East irrigation districts restricted customers to sprinkling two days per week, with an escalation path to a single day per week and then a complete outdoor sprinkler ban. [High] (source)
- Glenmore-Ellison Improvement District reservoirs were reported at 20 percent below normal filling capacity. [High] (source)
- Releases from the Okanagan Lake Dam at Penticton ran well below normal at four to six cubic metres per second since January, reflecting deliberate holding-back of water through the dry season. [High] (source)
- Average daily per-capita water consumption in the Okanagan was cited at 400 litres (contrasted with a 140-litre Australian government target), underscoring supply-management pressure on local utilities; the Okanagan has the lowest per-capita availability of freshwater in the country per Statistics Canada. [High] (source)
Quality of life
- Residential/domestic users across affected districts were held to lawn watering just twice a week under drought restrictions. [High] (source)
- Growers were asked to cut water use by 20 percent; those needing to upgrade irrigation equipment faced substantial cost (orchardist Nick Kiran estimated $60,000-$70,000 for ten acres), which many could not afford given low returns. [High] (source)
- The Okanagan’s wineries and fruit crops were reported as threatened by the water shortage, attributed to low rainfall and a smaller snowpack (June 10, 2009 media coverage). [Moderate] (source)
- Recreation was directly affected: Coyote Cruises had to cut its Penticton Channel inner-tube float course in half due to low water levels. [High] (source)
- The extreme dry conditions coincided with a major wildfire episode: on July 18, 2009 three wildfires (Glenrosa, Rose Valley, and Terrace Mountain) broke out around West Kelowna during extremely dry, windy conditions; over 20,000 people were evacuated and the Terrace Mountain fire burned roughly 9,877 hectares. [High] (source)
- A heat wave with highs in the high-30s Celsius and a campfire ban accompanied the early-August peak of the drought; the Environment Minister urged residents to avoid car washing, lawn watering and long showers. [Moderate] (source)
Environmental flow & fish
- Inflow to Okanagan Lake in the first six months of 2009 was the sixth-lowest since record-keeping began in 1921 and was explicitly worse than the 2003 drought year. [High] (source)
- Inflows to Okanagan Lake were 39 percent of normal between November 2008 and May 2009, and 44 percent of normal in April/May 2009 (Des Anderson, BC environment ministry). [High] (source)
- Okanagan Lake was about 48 cm below full pool on June 9 (roughly one-third of a metre below normal for the time of year), even at its seasonal peak, constraining the water available to meet downstream flow needs. [High] (source)
- Sockeye salmon recovery was at risk: the largest sockeye run in 50 years returned to the Okanagan River in fall 2008, with young salmon rearing in Osoyoos Lake; low water levels threatened managers’ ability to release sufficient flows in late August/September to relieve the downstream temperature/oxygen ‘squeeze’ (Howie Wright, senior biologist, Okanagan Nation Alliance). [High] (source)
- Okanagan Lake Dam releases were held at only four to six cubic metres per second since January - well below normal - which directly governs Okanagan River flows and downstream sockeye egg/fry survival. [High] (source)
- Mission Creek, the main tributary to Okanagan Lake, was so low that parts of its course were dominated more by rocks than water, indicating tributary/spawning-habitat stress. [High] (source)
6th-lowest since 1921 Okanagan Lake inflow rank
39% of normal Inflow, Nov 2008-May 2009
~48 cm Lake below full pool, June 9
Sources: obwb.ca · obwb.ca · obwb.ca · obwb.ca · en.wikipedia.org · obwb.ca